DatasetEquity: Are All Samples Created Equal?

In The Quest For Equity Within Datasets.

Ford Motor Company

NuScenes

nuscenes_training_clusters_gif

KITTI

kitti_training_clusters_gif

Waymo

waymo_training_clusters

BDD100k

bdd100k_training_clusters

TuSimple

tusimple_training_clusters_gif

dequity_loss

Generalized Focal Loss We propose a novel loss function called Generalized Focal Loss, which addresses the issue of data imbalance in computer vision by weighting each sample differently based on its likelihood of occurrence, leading to improved performance on downstream computer vision tasks.

dataset_equity_dd3d_top

Comparison of BEV AP for a camera-based 3D object detection method called DD3D, with and without the proposed Generalized Focal Loss function, showing a significant improvement in performance when using the proposed loss function, particularly as the difficulty of the problem increases.

Abstract

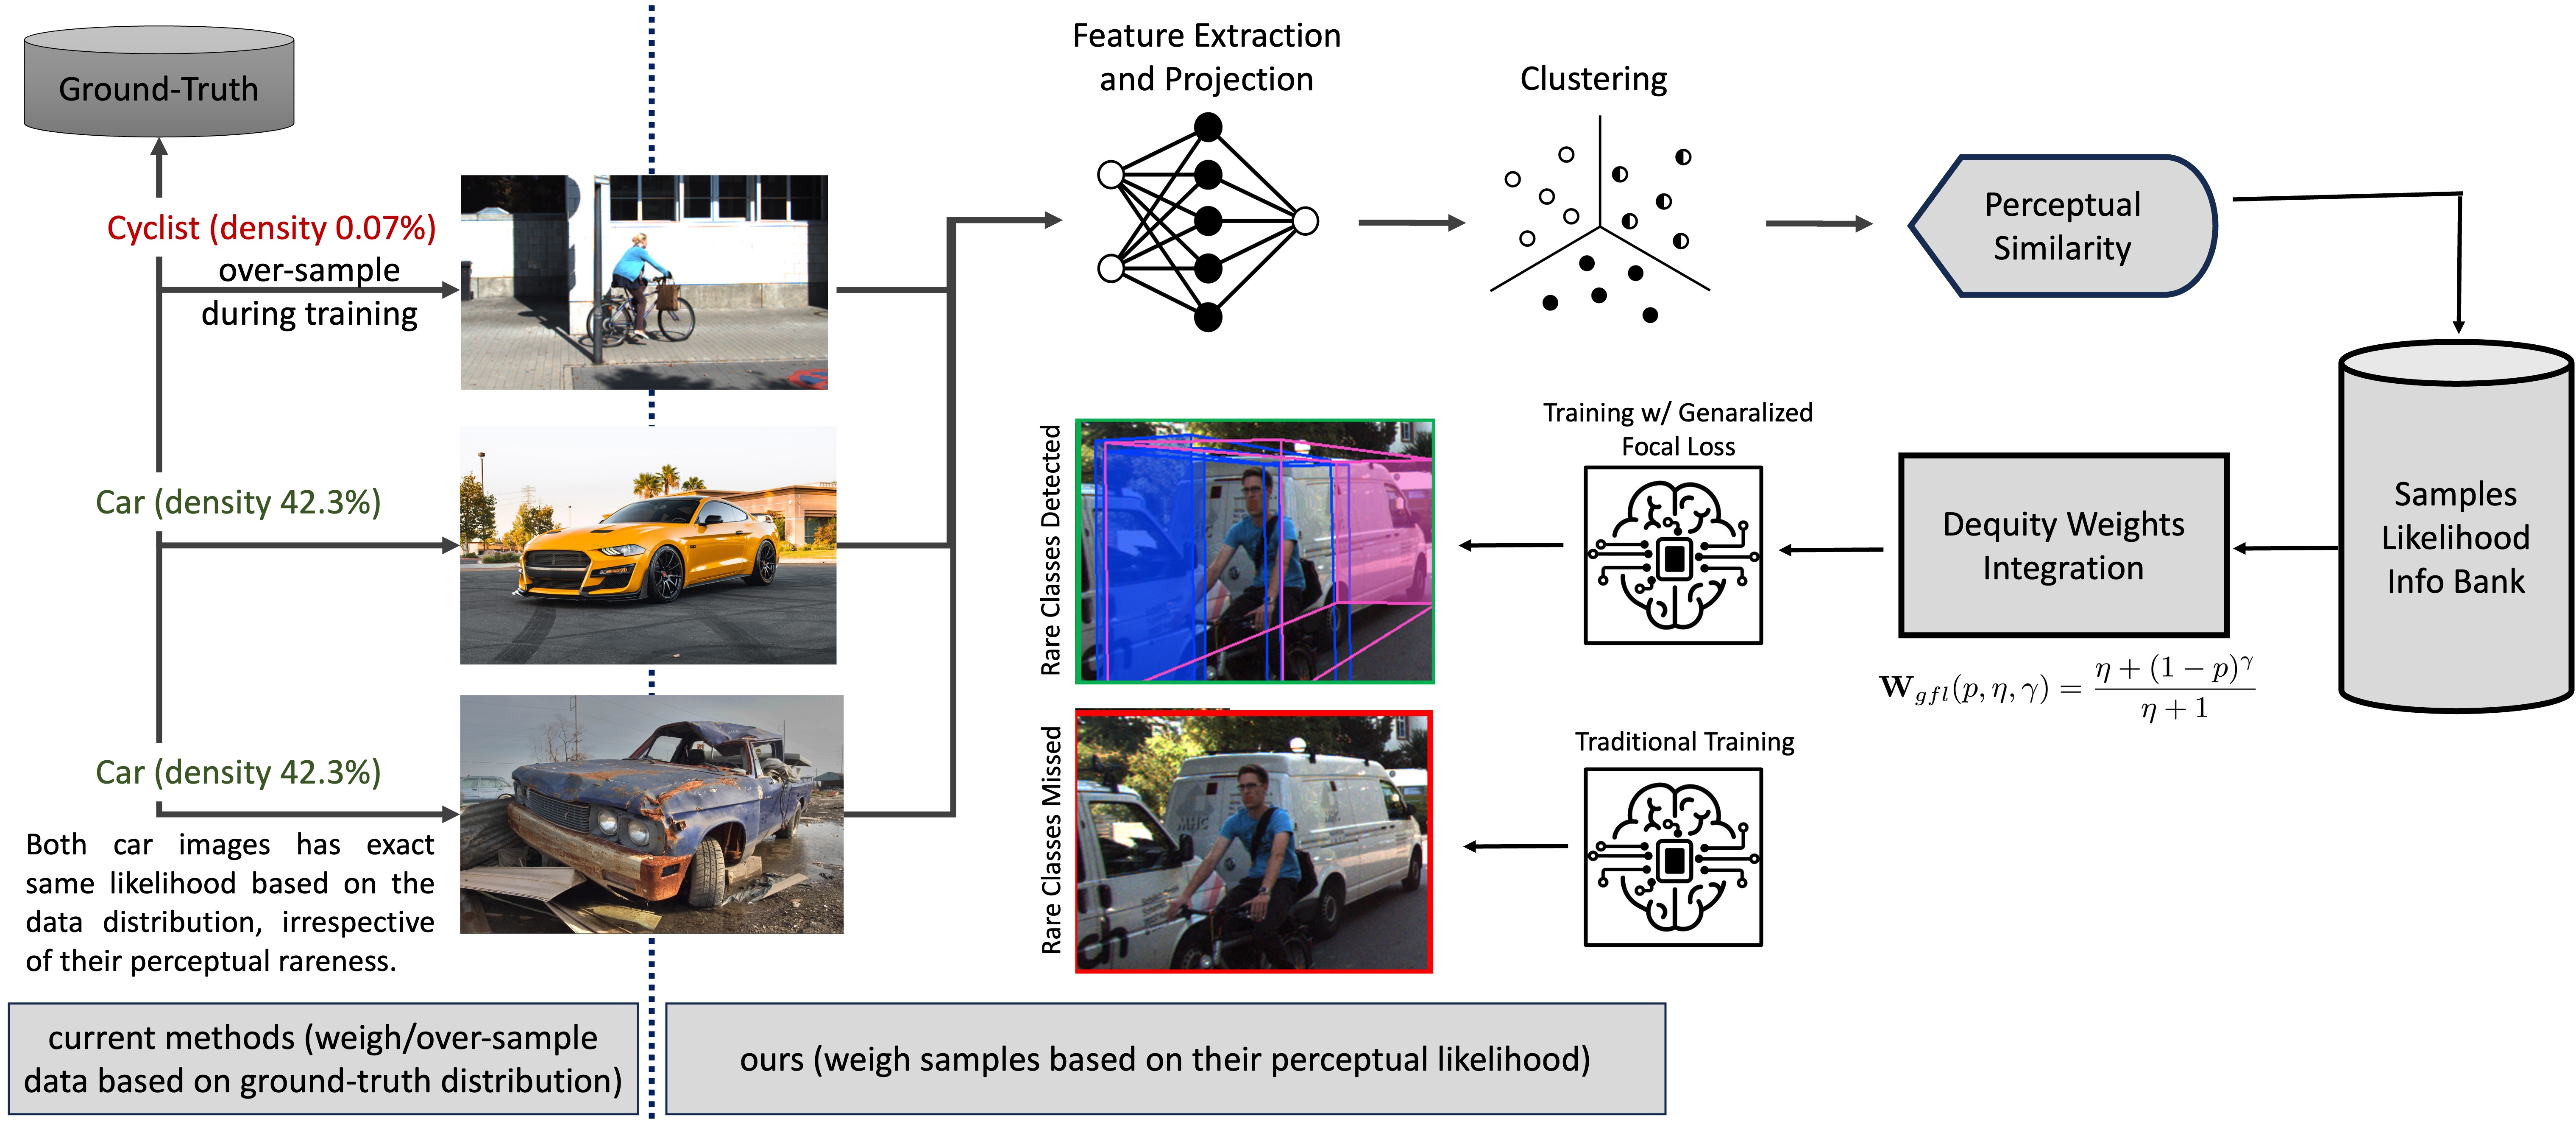
Data imbalance is a well-known issue in the field of machine learning. It is caused by a variety of factors such as the cost of data collection, the difficulty of labeling, and the geographical distribution of the data. In computer vision, bias in data distribution caused by image appearance remains highly unexplored. This paper presents a novel method for addressing data imbalance in the field of machine learning, specifically in the context of 3D object detection in computer vision. The proposed method involves weighing each sample differently during training according to its likelihood of occurrence within the dataset, which improves the performance of state-of-the-art 3D object detection methods in terms of NDS and mAP scores. 
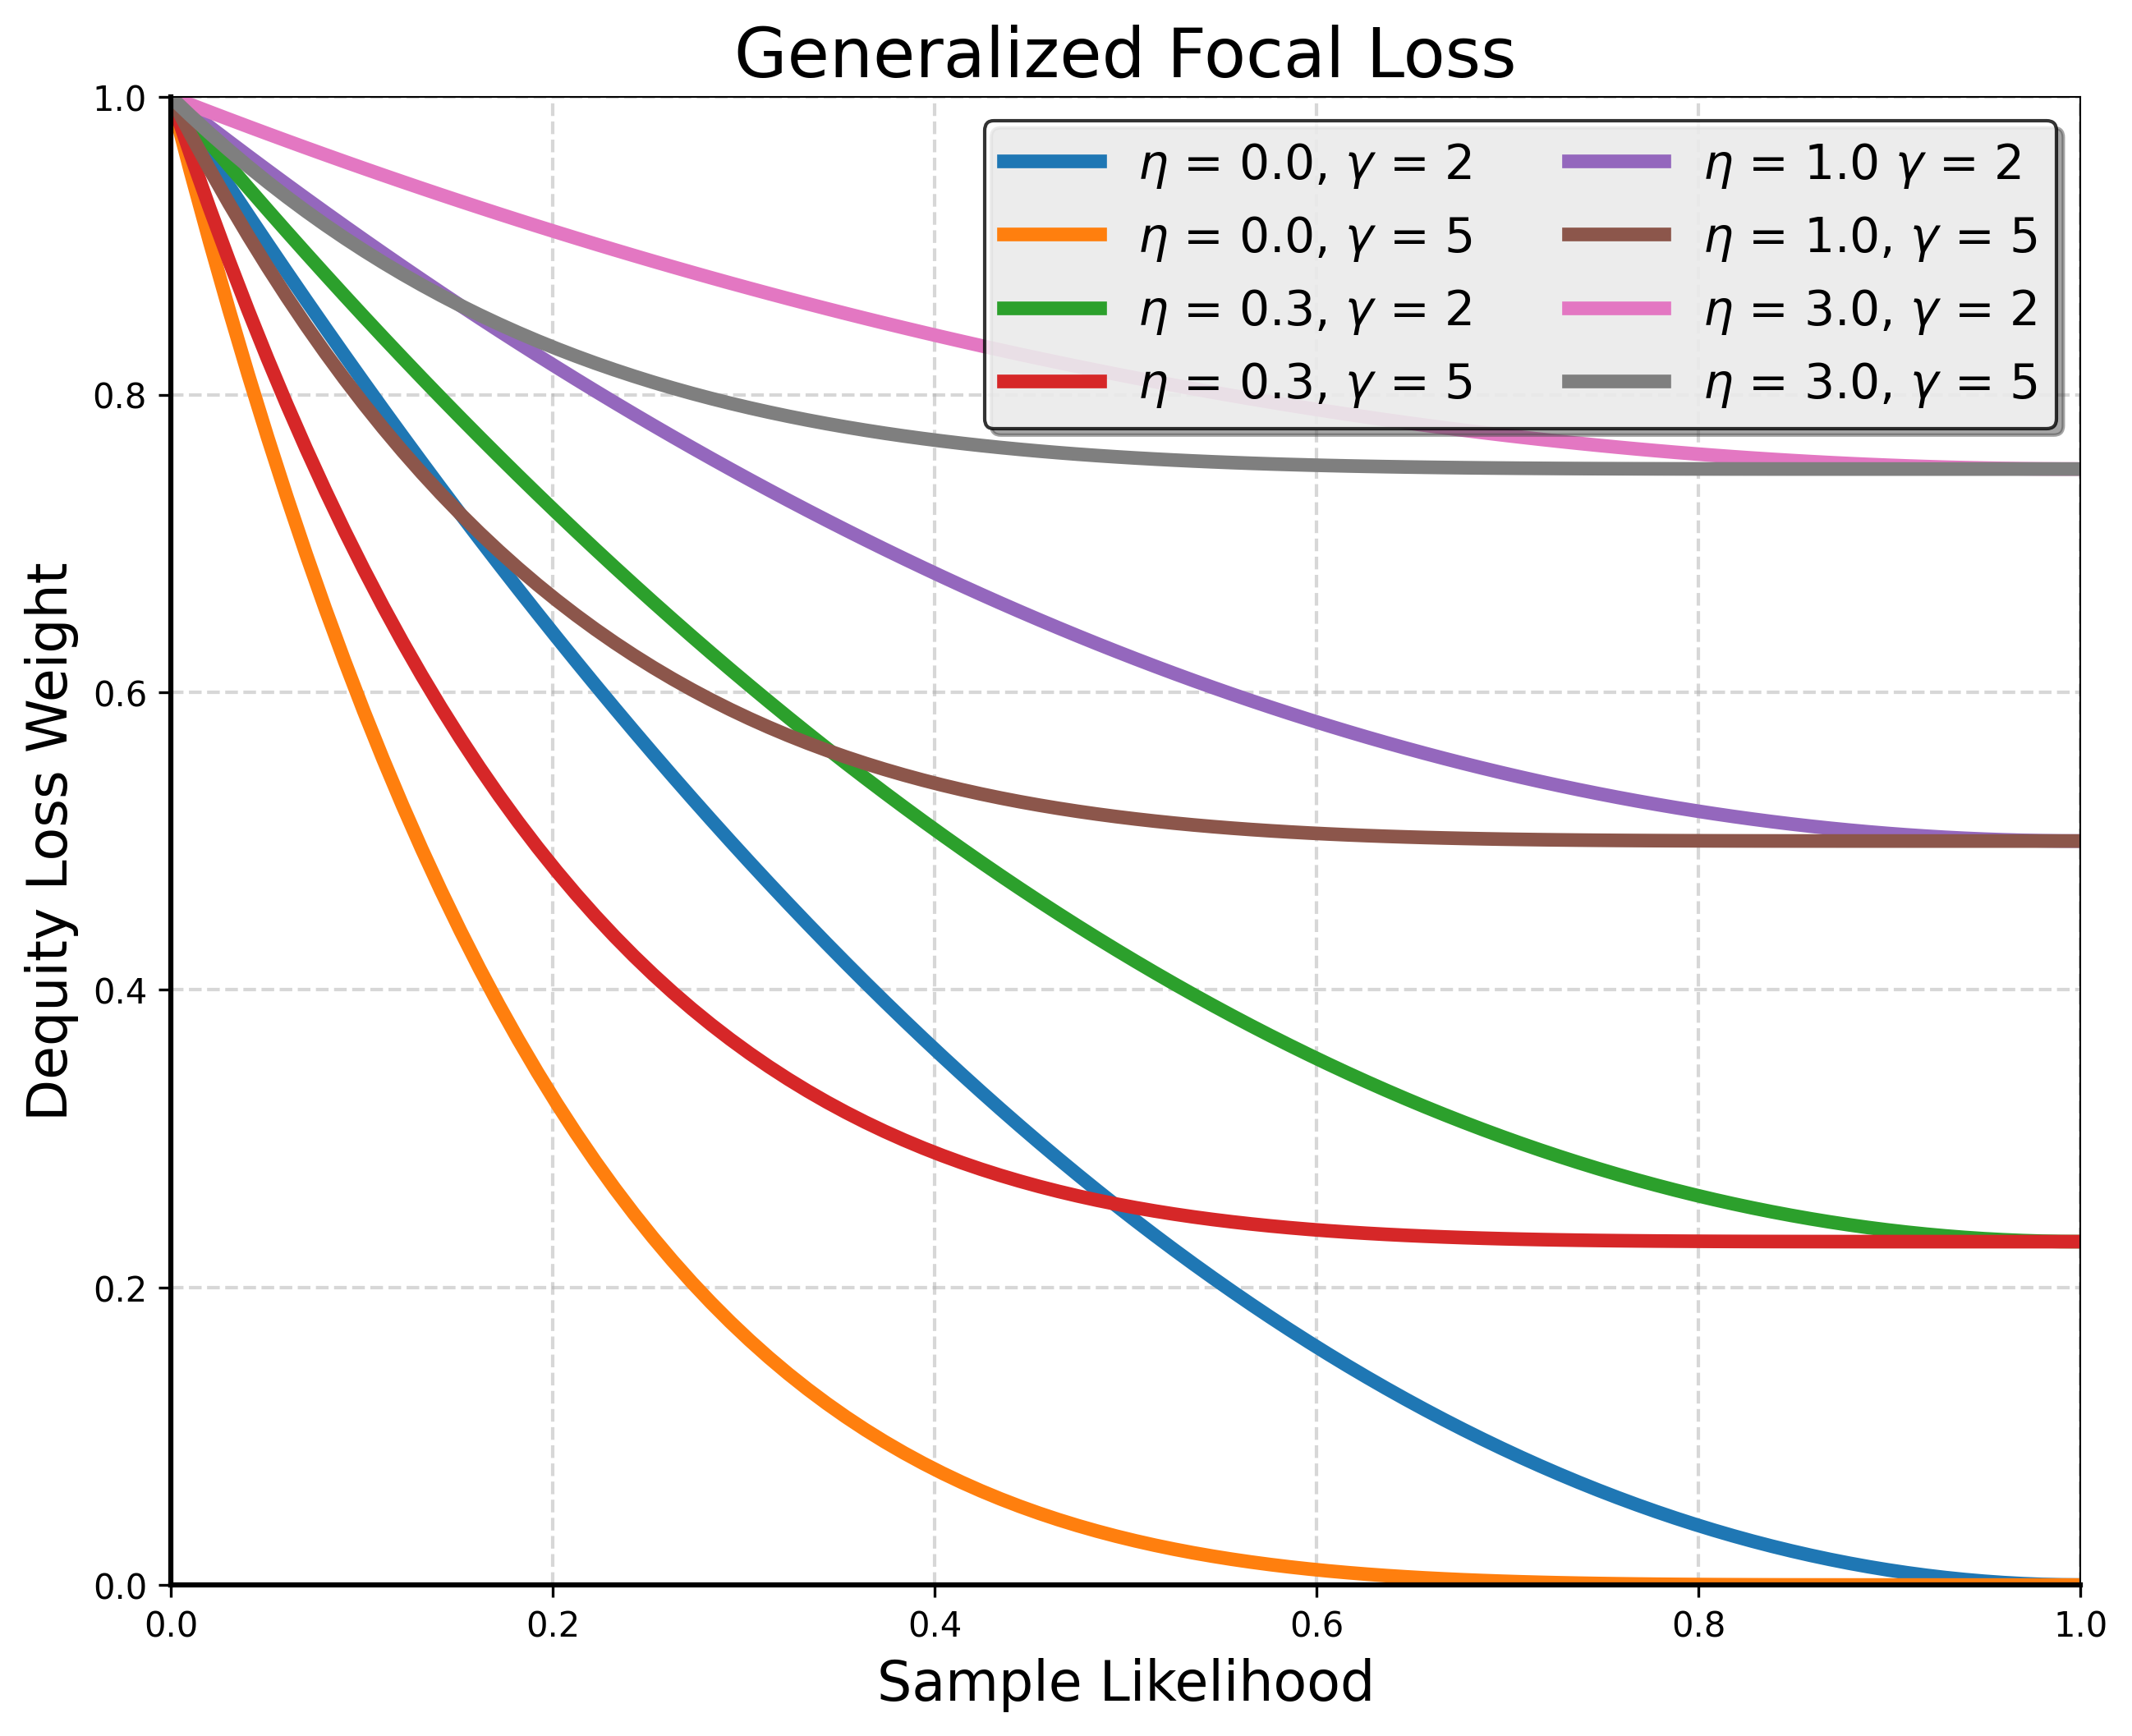
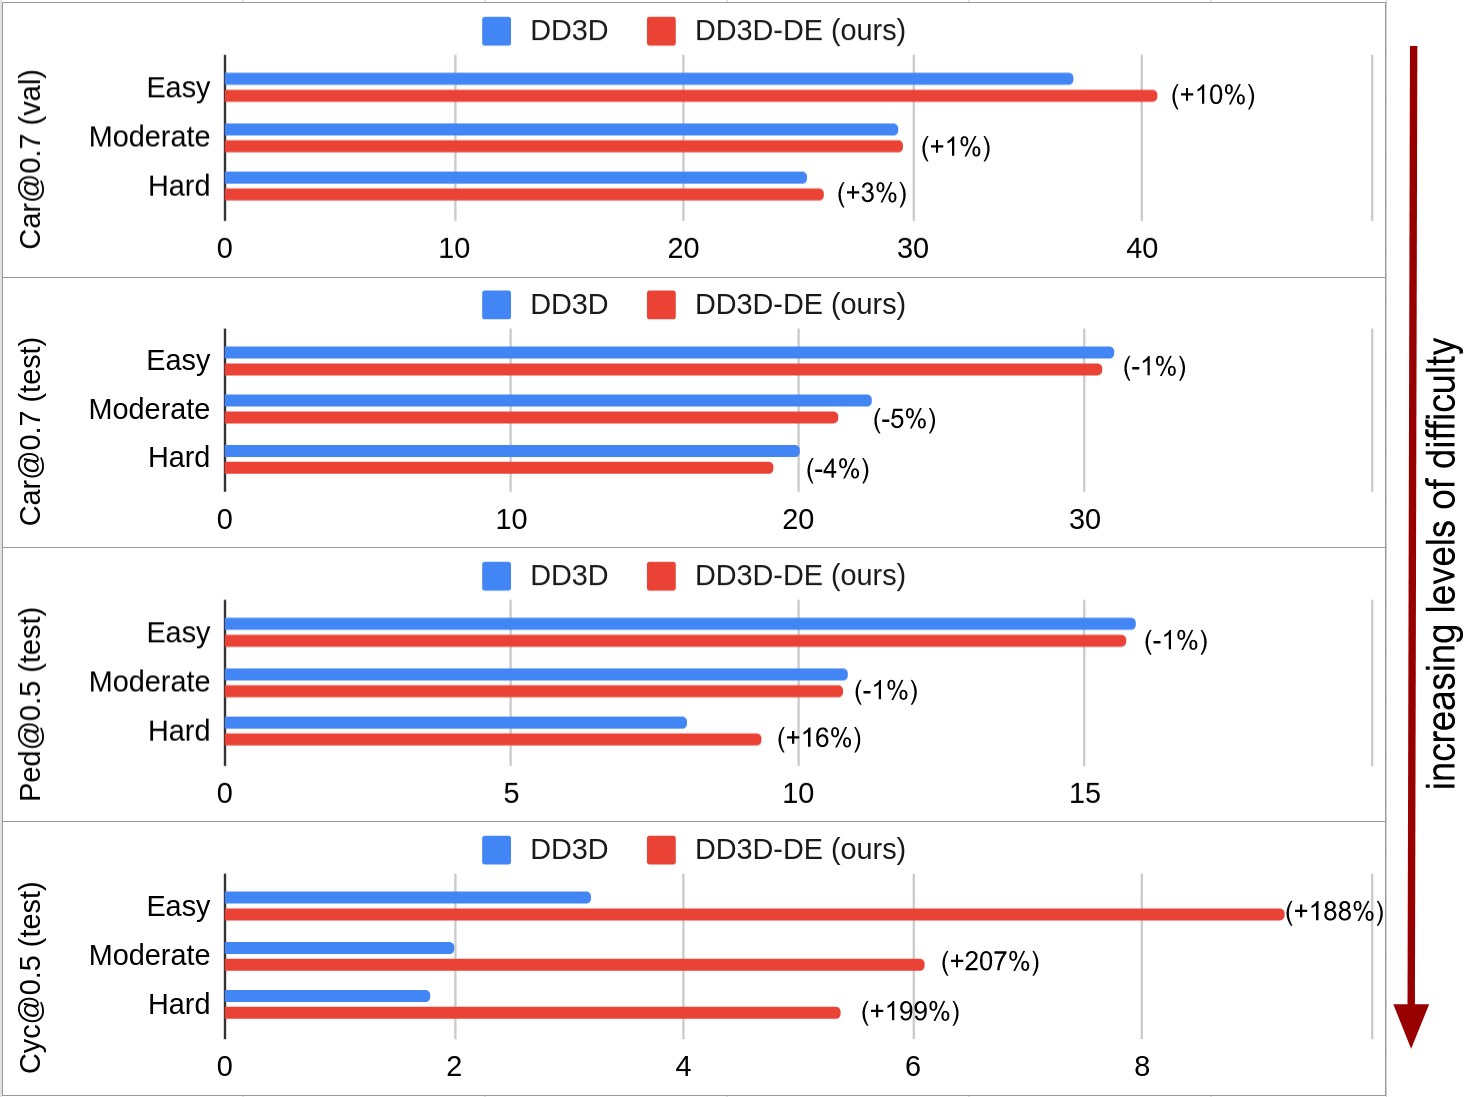
The effectiveness of the proposed loss function, called Generalized Focal Loss, was tested on two autonomous driving datasets using two different state-of-the-art camera-based 3D object detection methods. The results show that the loss function is particularly effective for smaller datasets and under-represented object classes.

Video

Cluster Visualization

nuscenes_training_clusters

nuScenes cluster: nuScenes is a large-scale multi-modal dataset for autonomous driving, and consists of 1000 scenes, each roughly ~20s long with key samples annotated at 2Hz, collected in Boston and Singapore. The dataset contains 6 cameras covering the full 360 degrees field-of-view and has a total of 28130 samples for training, 6019 samples for validation, and 6008 samples for testing. For the object detection task, they have 1.4M 3D bounding boxes manually annotated for 23 object classes. This dataset also provides the official evaluation metrics for the 3D object detection task and is slightly different from the one used for KITTI dataset.

kitti_training_clusters

KITTI cluster: KITTI 3D object detection benchmark is one of the most popular autonomous driving benchmarks and consists of 7481 training samples, and 7518 testing samples. KITTI dataset provides no validation set, however, it is common practice to split the training data into 3712 training and 3769 validation images as proposed in , and then report validation results. This benchmark consists of 8 different classes but evaluates only 3 classes: car, pedestrian, and cyclist.

bdd100k_training_clusters

BDD100K cluster: the BDD100K dataset contains mostly two scenarios - daylight and nighttime. Semantic clustering of this dataset also reveals two major clusters for the said frames and a few small clusters representing outlier scenarios such as high reflections from brake lights, sun flare, etc.

waymo_training_clusters

Waymo cluster: As indicated in the figure, with the visualization on most likely clusters of dataset samples, several semantic meaning cluster have formed, namely cluster 87 of city crosswalk, cluster 3 of residential driving scene after sunset, cluster 31 of crowded driving scenes, and cluster 1 of night rainy driving with glare.

tusimple_training_clusters

TuSimple cluster: TuSimple Lane detection dataset projected to a 3D T-SNE embedding space and clustered using DBSCAN algorithm (only first 2-dimensions visualized). Each color represents a unique cluster ID. The samples are semantically similar to each other in T-SNE space in the clusters as shown in this figure. It has 1 main cluster ~127K samples and 5 tiny clusters ~40 samples each

Architecture

DatasetEquity_architecture

High-dimensional features extracted from images are first projected down onto a lower-dimensional space (e.g. 3D) using a method such as t-SNE. These features are then clustered using an algorithm such as DBSCAN to identify frames with similar semantics in the same bucket. Relative sizes of these clusters define sample likelihoods, which are further used to compute Dequity Loss Weights to weigh errors computed during the optimization process accordingly.

Cluster Distribution

data_distribution

Samples cluster scaled probabilities for KITTI, nuScenes, Waymo, BDD100K dataset.

NuScenes Cluster Samples

nuscenes_samples

KITTI Cluster Samples

kitti_samples

Waymo Cluster Samples

waymo_samples

BDD100K Cluster Samples

bdd100k_samples

TuSimple Cluster Samples

tusimple_samples

Downstream Task Improvements

table

3D detection results on KITTI test set. The suffix DE signifies our method of applying Generalized Focal Loss weights to each sample. Best results are highlighted in bold. Value of eta and gamma in the Generalized Focal Loss weight was set to 1.0, and 5.0 respectively. Class@N in this table refers to the AP|R40 score computed for Class at an IoU threshold of N.

qualitative

Qualitative analysis of predictions from the baseline DD3D-DE model and our DD3D-DE model. The samples shown here were randomly drawn from the split of the KITTI test split. As shown in the images, DD3D-DE improves the performance over the baseline model on under-represented, and out-of-distribution samples containing objects such as Van, Cyclist, and occluded or far away Car.